
Kuala Lumpur Investment · 7 min
Highest Rental Yield Areas In KL: What Investors Should Check
吉隆坡租金回报较高地区怎样筛选
Wondering which KL areas have stronger rental yield? Compare indicative gross-yield bands, tenant depth, entry price, transit access and vacancy risk before shortlisting.
Buyer Decision Table
Use this guide as a checklist before comparing individual projects.
Factor
Why It Matters
Next Check
Factor
Why It Matters
Next Check
Factor
Why It Matters
Next Check
| Factor | Why It Matters | Next Check |
|---|---|---|
| Budget | A good project can still be wrong if monthly cash flow or DSR is uncomfortable. | Use calculators and confirm loan comfort. |
| Rental demand | Investment logic depends on tenant depth, vacancy risk and realistic rent evidence. | Check PropertyGuru, iProperty, SPEEDHOME and nearby completed supply. |
| Exit strategy | The project should have a clear future buyer or tenant audience. | Compare transaction data, layout, supply and alternative projects. |
KL Rental Yield Area Ranking
These are screening bands to verify with current PropertyGuru, iProperty, SPEEDHOME, Brickz and EdgeProp checks. They are not guaranteed returns.
Gross Yield Guide
Tenant Profile
Why It Can Work
Risk To Verify
Gross Yield Guide
Tenant Profile
Why It Can Work
Risk To Verify
Gross Yield Guide
Tenant Profile
Why It Can Work
Risk To Verify
Gross Yield Guide
Tenant Profile
Why It Can Work
Risk To Verify
Gross Yield Guide
Tenant Profile
Why It Can Work
Risk To Verify
| Area | Gross Yield Guide | Tenant Profile | Why It Can Work | Risk To Verify |
|---|---|---|---|---|
| Cheras / Maluri / Taman Connaught | 4.5% - 6.0% gross screening band | MRT-linked local tenants, students, healthcare workers and practical city commuters. | Entry prices can be more practical than prime KL while transit and mature amenities support rental demand. | Older stock, parking, traffic, building condition and direct competition from nearby completed projects. |
| Bukit Jalil / OUG | 4.0% - 5.5% gross screening band | Family tenants, Pavilion Bukit Jalil workers, students and buyers who want mature convenience. | The Pavilion ecosystem, highway access and mixed own-stay demand can support rent when entry price is controlled. | High new supply, furnishing cost, unit size mismatch and projects relying only on rebate-driven pricing. |
| Bangsar South / Kerinchi | 3.8% - 5.2% gross screening band | Office tenants, transit users, young professionals and renters linked to KL-PJ job nodes. | Office density and rail access can create deeper rental enquiries for compact, efficient units. | Higher entry price, competing completed supply, traffic and whether rent still covers holding cost. |
| KLCC / Bukit Bintang | 3.0% - 4.8% gross screening band | Expatriates, city professionals, lifestyle renters and buyers who value central liquidity. | Prime location can create strong tenant enquiries, but yield depends heavily on entry price and maintenance fee. | Premium pricing, high maintenance, luxury competition, vacancy buffer and foreign-buyer liquidity. |
| Mont Kiara / North Kiara | 3.0% - 4.5% gross screening band | Expat families, international school households, professional tenants and long-stay renters. | The area can have sticky family tenant demand, especially for practical layouts and good building management. | Older condo competition, large-unit affordability, high maintenance and slower resale for weak layouts. |
Suburban Cheras/Setapak Beats Premium KLCC On Yield, Not On Rent
Real case-study data illustrates the trade-off directly: a RM450,000 Setapak unit renting at RM2,200/month nets a 5.9% gross / 4.7% net yield, while a RM1,200,000 KLCC unit renting at RM4,500/month nets only 4.5% gross / 3.7% net — the KLCC unit earns double the rent but the entry price more than doubles too. A Cheras transit-oriented unit at RM400,000 renting RM1,800/month scores 5.4% gross / 3.8% net with high MRT-driven occupancy. If your goal is yield percentage, suburban transit corridors currently out-perform prime KL; if your goal is rent-per-unit stability with a deeper-pocketed tenant pool, KLCC/Bukit Bintang still wins despite the lower yield.
Leverage Can Flip a Decent Gross Yield Into Negative Cashflow
A RM800,000, 1,000 sqft condo renting fully-furnished at RM3,500/month looks reasonable on gross yield, but under a 90% LTV mortgage the full monthly cost stack — mortgage (RM2,920-RM3,150), maintenance (RM300 at RM0.30 psf), sinking fund (RM30), assessment, quit rent, insurance, amortised income tax, agent commission, vacancy allowance and furnishing depreciation — leaves the investor RM592-RM822 out of pocket every month. Rent would need to reach roughly RM4,100 (a 6.15% gross yield) just to break even under Islamic financing. Always run this full cost stack before assuming a gross yield figure translates into positive cashflow.
Tenant Depth Matters More Than Headline Yield
KL areas with offices, universities, hospitals, transit or mature local communities have deeper, more resilient tenant pools than areas relying on launch marketing alone. Cyberjaya's tech and data-centre workforce, for instance, supports steady 3.5-5.0% net returns on affordable entry points even without prime-KL prestige — occupancy stability, not just the yield number, protects your actual annual return.
Common Questions
Which KL area has the highest rental yield?
Suburban transit corridors like Cheras and Setapak currently show the strongest gross yields (5.0-7.0%) versus KLCC/Bukit Bintang's tighter 2.0-4.0% range — but always convert to net yield and check tenant depth before deciding, since prime areas offer higher absolute rent and more stable long-term tenancy.
Is KLCC high yield?
No — case-study data shows a typical KLCC unit nets around 3.7-4.5%, well below suburban alternatives, because acquisition cost (RM1,200-RM1,550 psf) rises faster than achievable rent. KLCC's advantage is tenant depth and liquidity, not yield percentage.
Investor next paths
Turn this guide into a shortlist.
Use these pages to compare location, numbers, project fit and next action before messaging Lewis.
Highest rental yield areas in KL
Compare tenant demand, entry price, maintenance, vacancy risk and net yield.
Rental yield calculation guide
Check rent, holding cost, furnishing budget, vacancy and exit demand.
Rental yield and ROI calculators
Estimate yield, cash flow and holding cost before asking for latest package.
Related Projects

Centrix KLCC
KLCC, Kuala Lumpur
From RM 908K≈ RM 3,716 /month (90% loan est.)
Leasehold · Serviced Residence · 571 - 1187 sqft · Studio - 3 rooms

The Conlay
KLCC, Kuala Lumpur
From RM 1.46M≈ RM 5,977 /month (90% loan est.)
Freehold · Serviced Residence · 743 - 1335 sqft
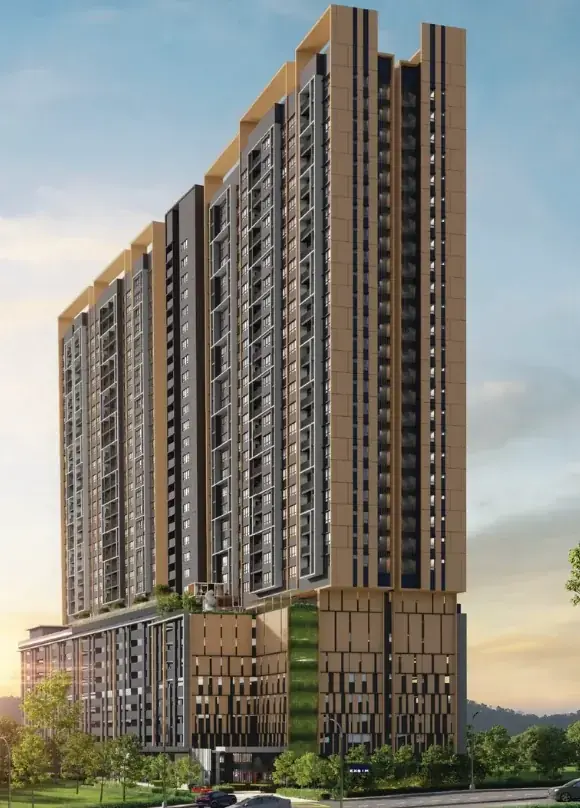
D'Evia
Kwasa Damansara, Selangor
RM 450K – RM 799K≈ RM 1,842 /month (90% loan est.)
Leasehold · Serviced Residence · 657 - 1109 sqft · 2 - 4 rooms